01 / Case Study · 2026
Across Hours
Time, visualised globally.
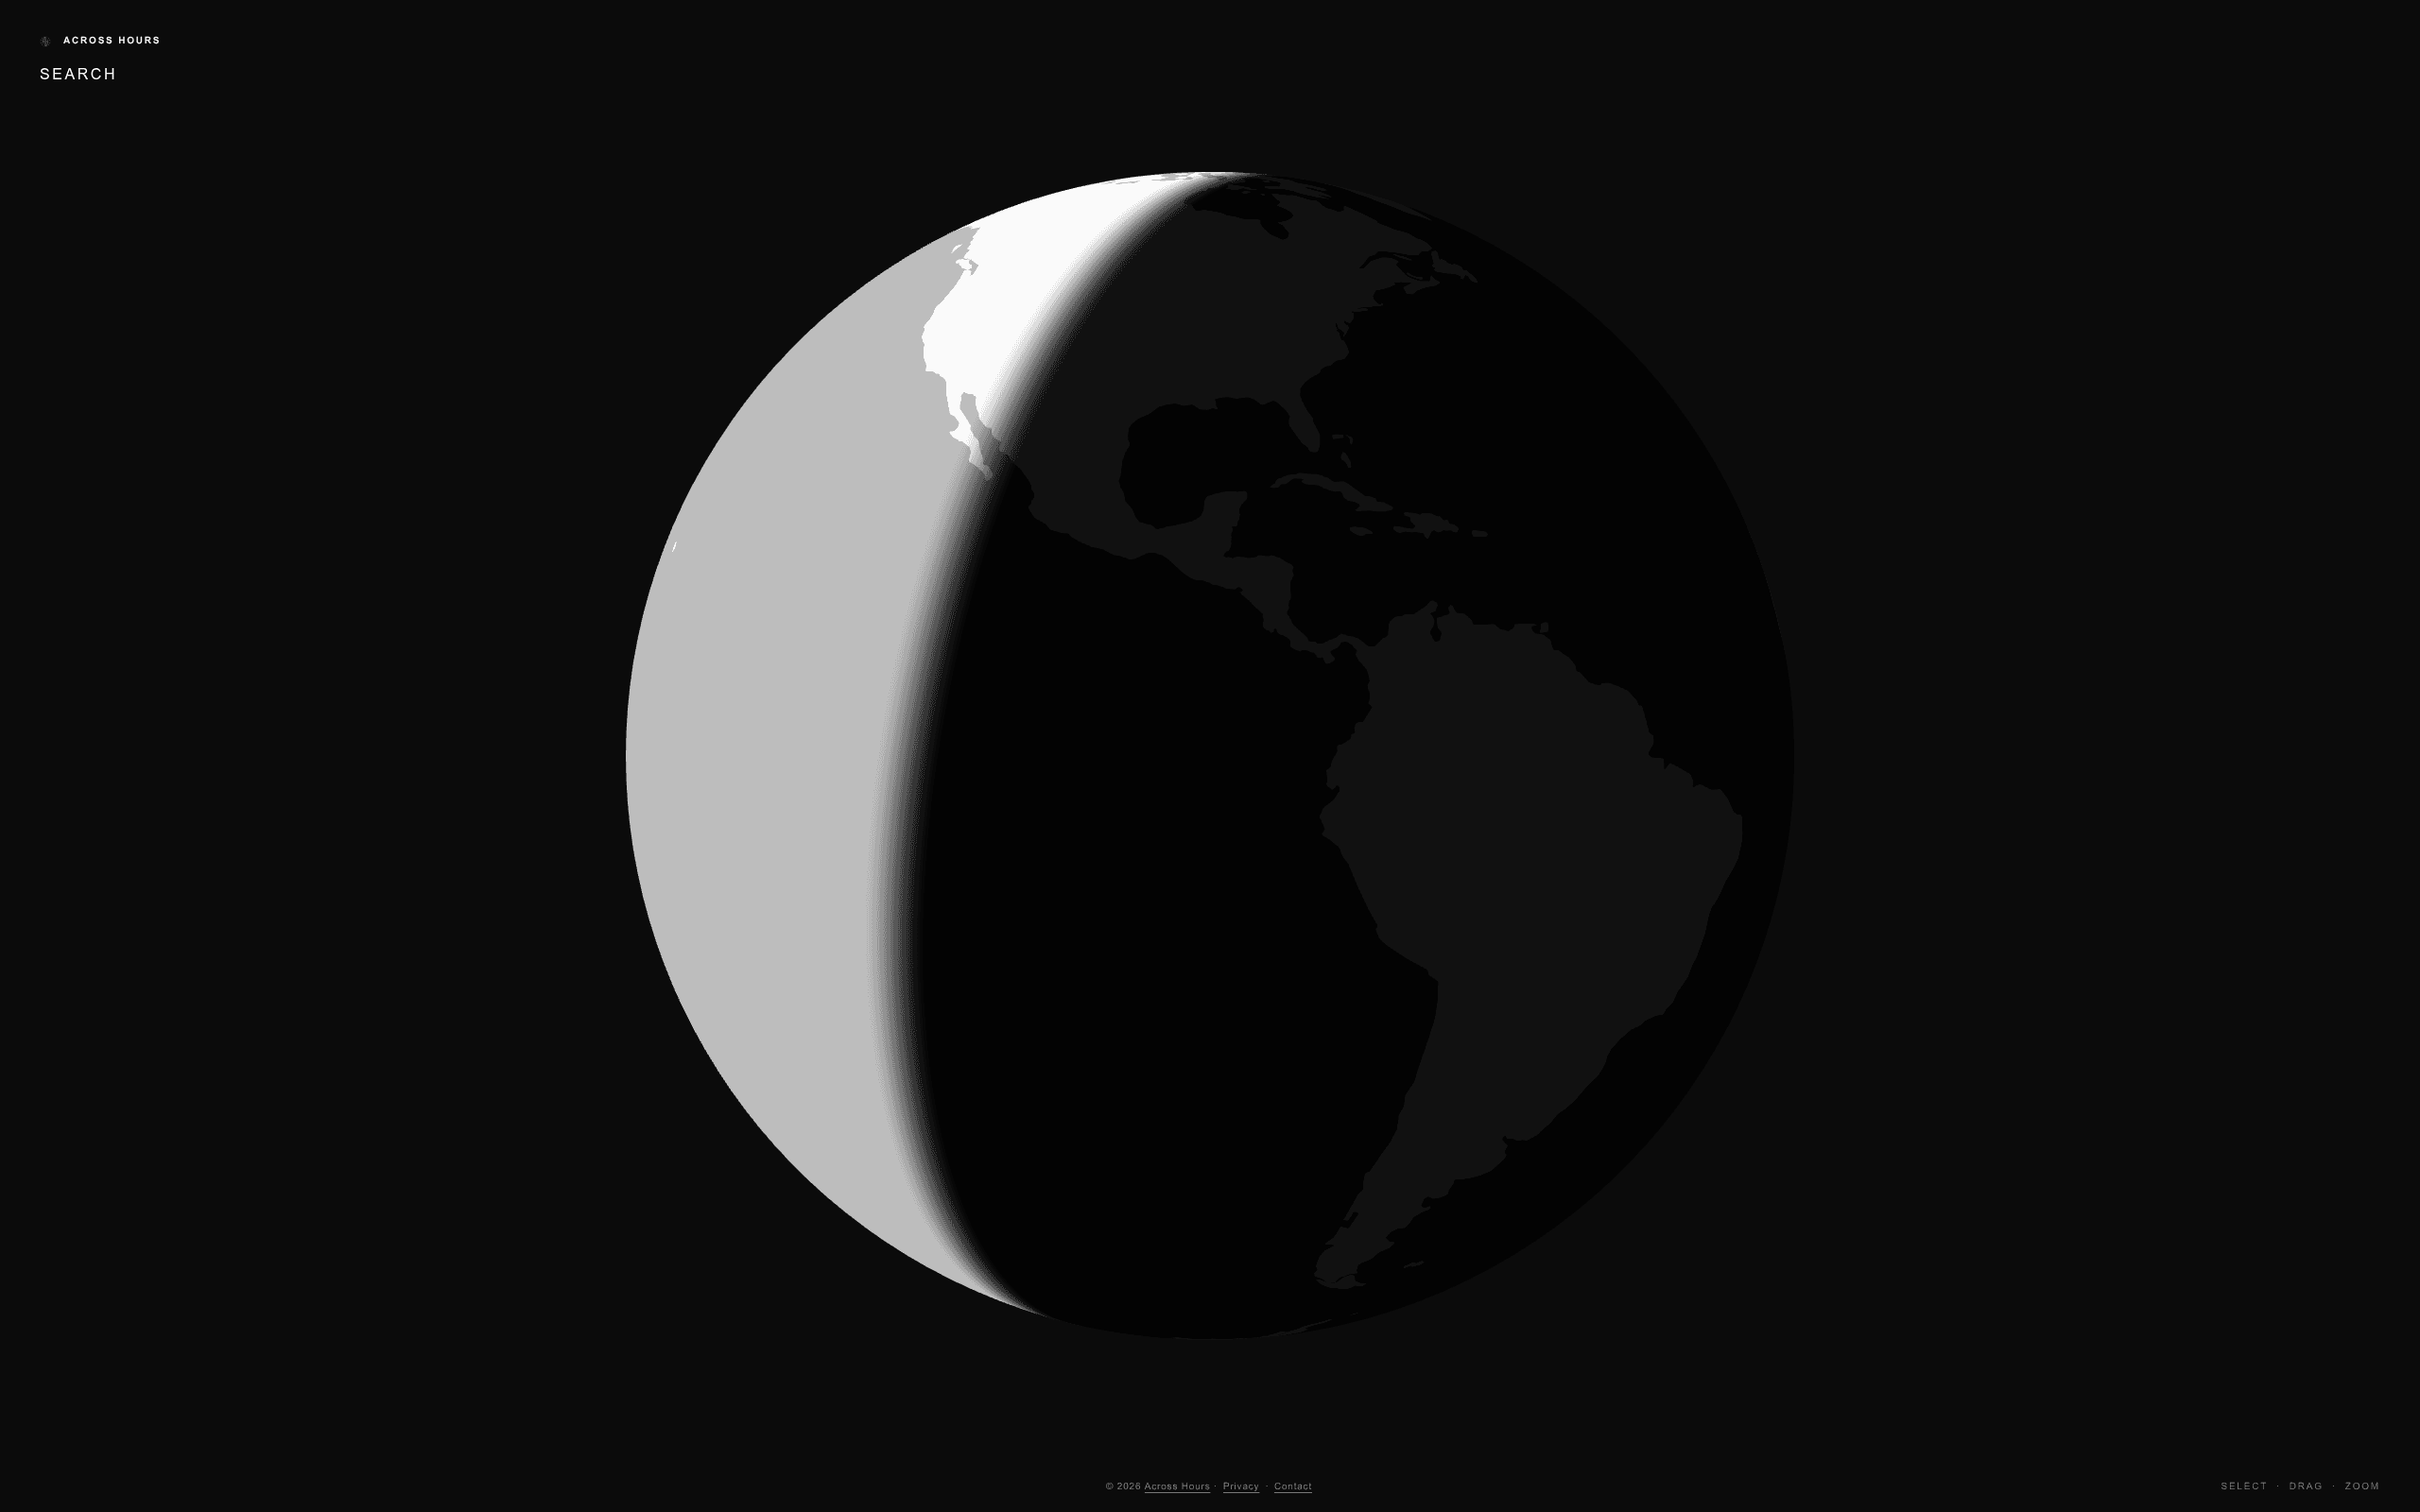
Across Hours is an interactive world-time application I designed and developed around a live 3D globe. It makes daylight, local time and global relationships spatial rather than abstract.
Product Design · UI/UX · Frontend · WebGL · Production
React · TypeScript · Three.js · WebGL · Vite · PWA
World Time · Solar Visualisation · Spatial Interaction
Live at acrosshours.com
02 / The problem
A clock tells you the hour. Not the relationship.
Conventional world clocks turn places into rows of offsets. They answer what time it is, but they hide where another person is on the planet, whether they are in daylight, and how their day relates to yours.
Across Hours starts from geography instead. The globe is the organising model, so daylight, distance and local time can be read together rather than as separate pieces of information.
The design challenge was to add enough context to make the utility genuinely useful without allowing search panels, saved places or time labels to overpower the spatial idea.
03 / How it works
From a place name to a spatial understanding.
The interaction stays intentionally direct: find a place, inspect its local context, then use the globe to understand the relationship.
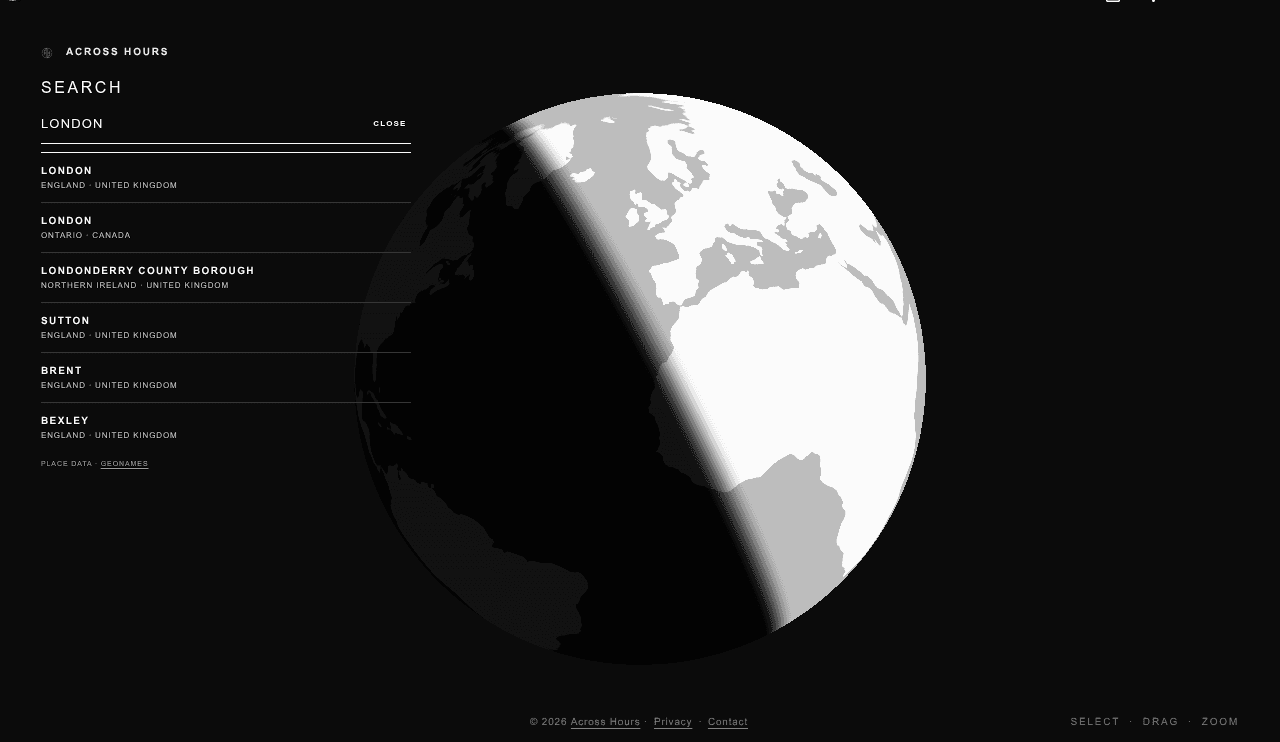
Search a place
Type a location and the globe remains visible while place data resolves in context. Search supports the spatial model instead of replacing it with a separate screen.
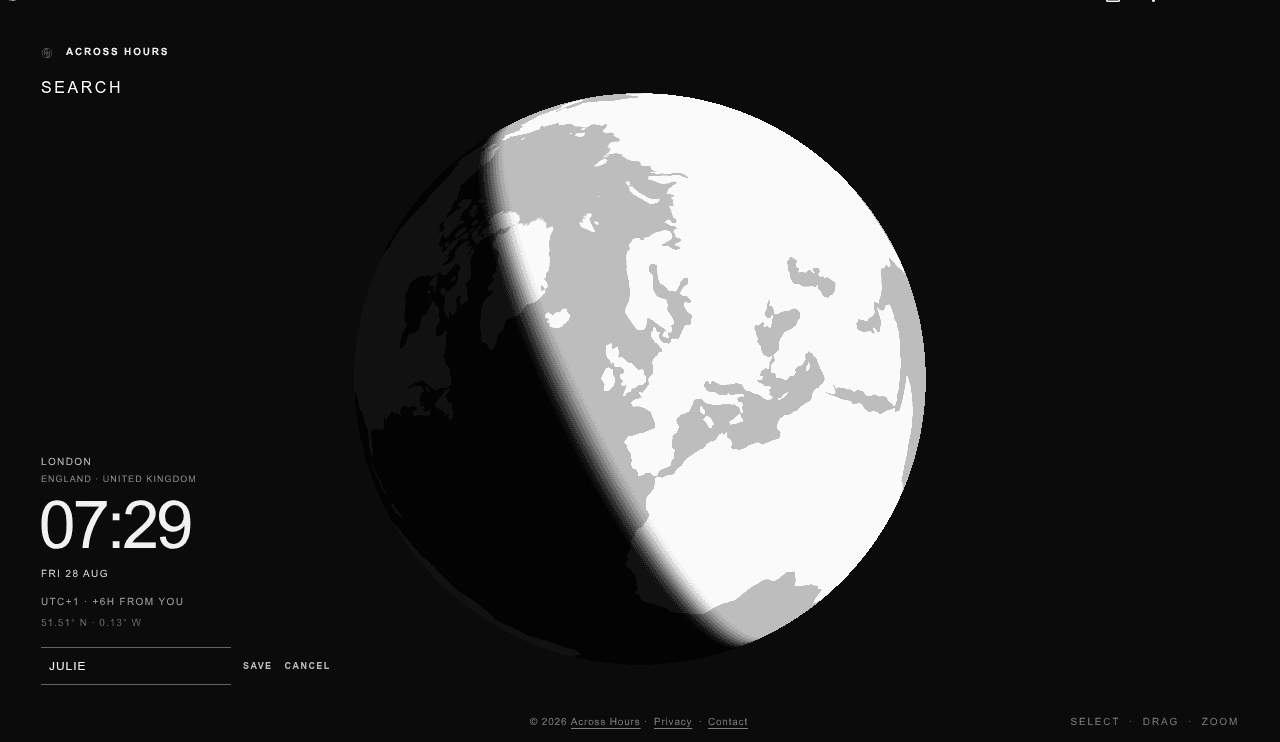
Inspect local time
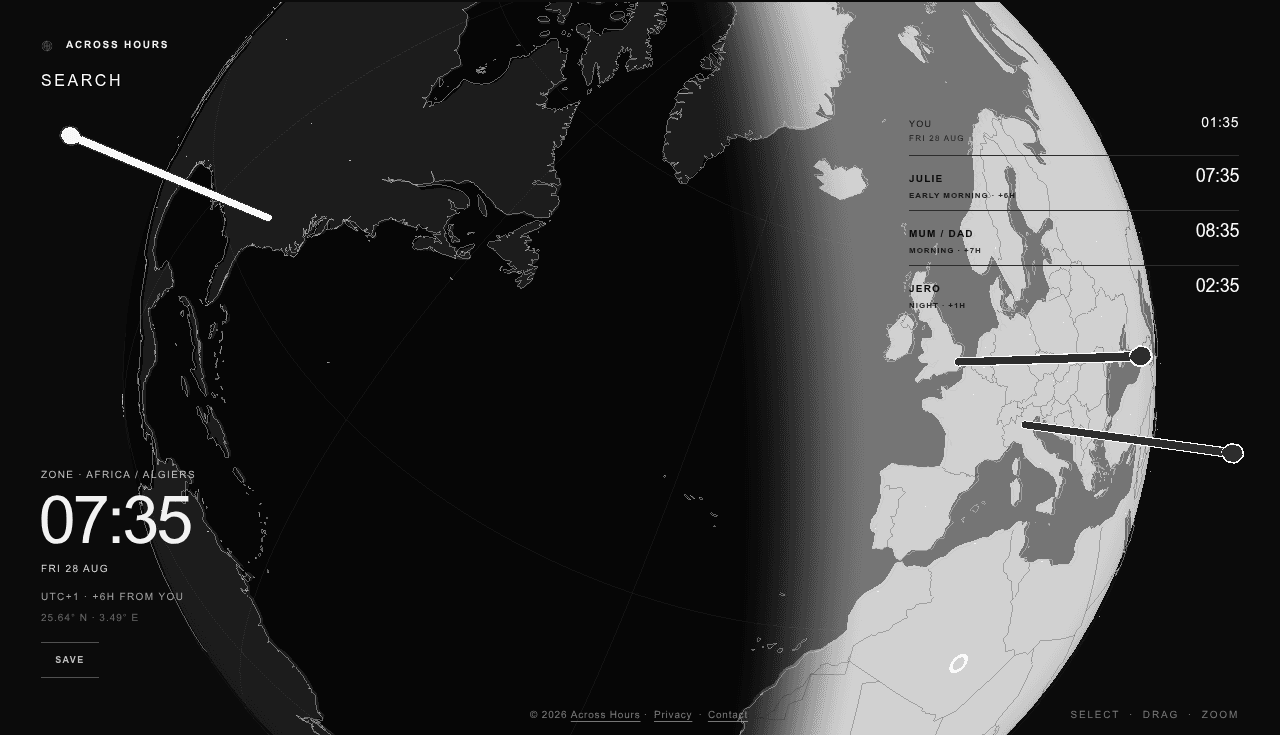
Selecting a place moves from search to a focused time state: local time, date, offset from the user and coordinates are readable without losing the geographic relationship.
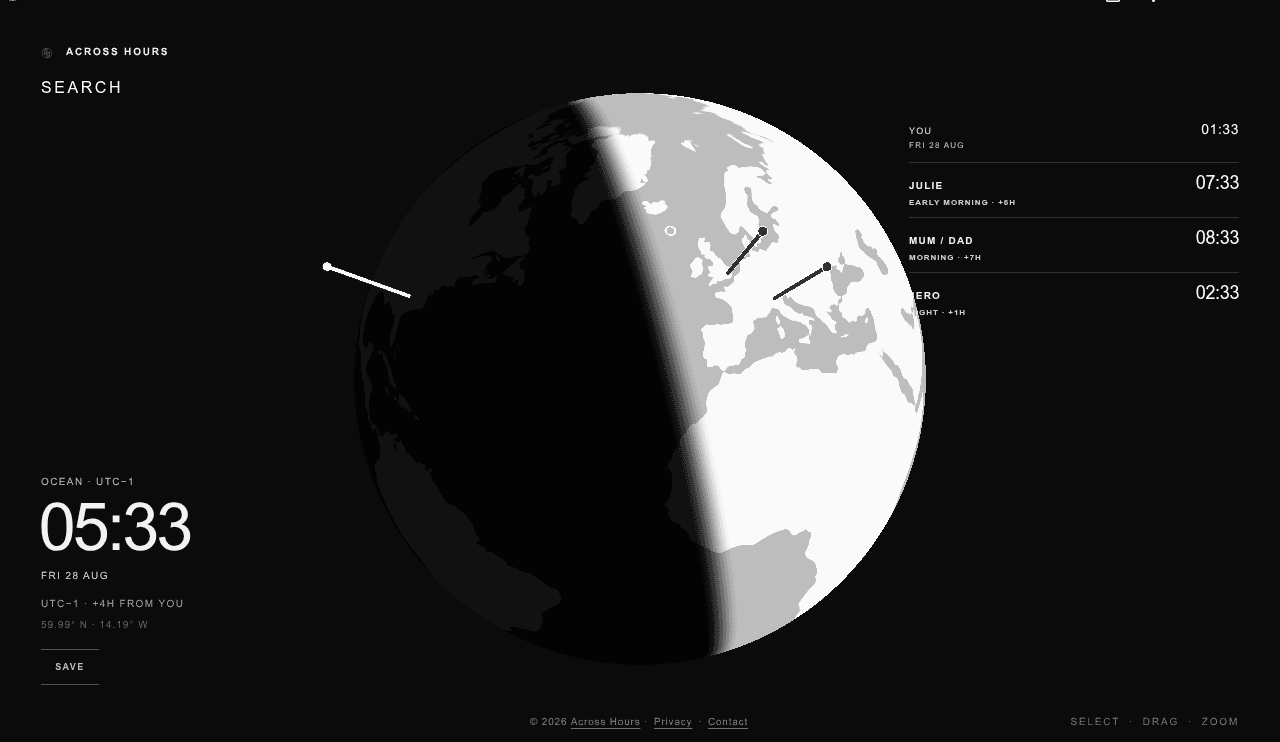
Compare relationships
Saved places become spatial markers and a compact time list. Rotating and zooming makes distance, daylight and time difference understandable as one connected view. London, for example, can be read not only as UTC+1, but as a place six hours ahead of the user’s local context and already in a different part of the day.
04 / Visual system
The terminator is the interface.
The monochrome planet keeps attention on form and light. The moving boundary between day and night is both information and visual identity; the rest of the UI exists to support it, not decorate it.
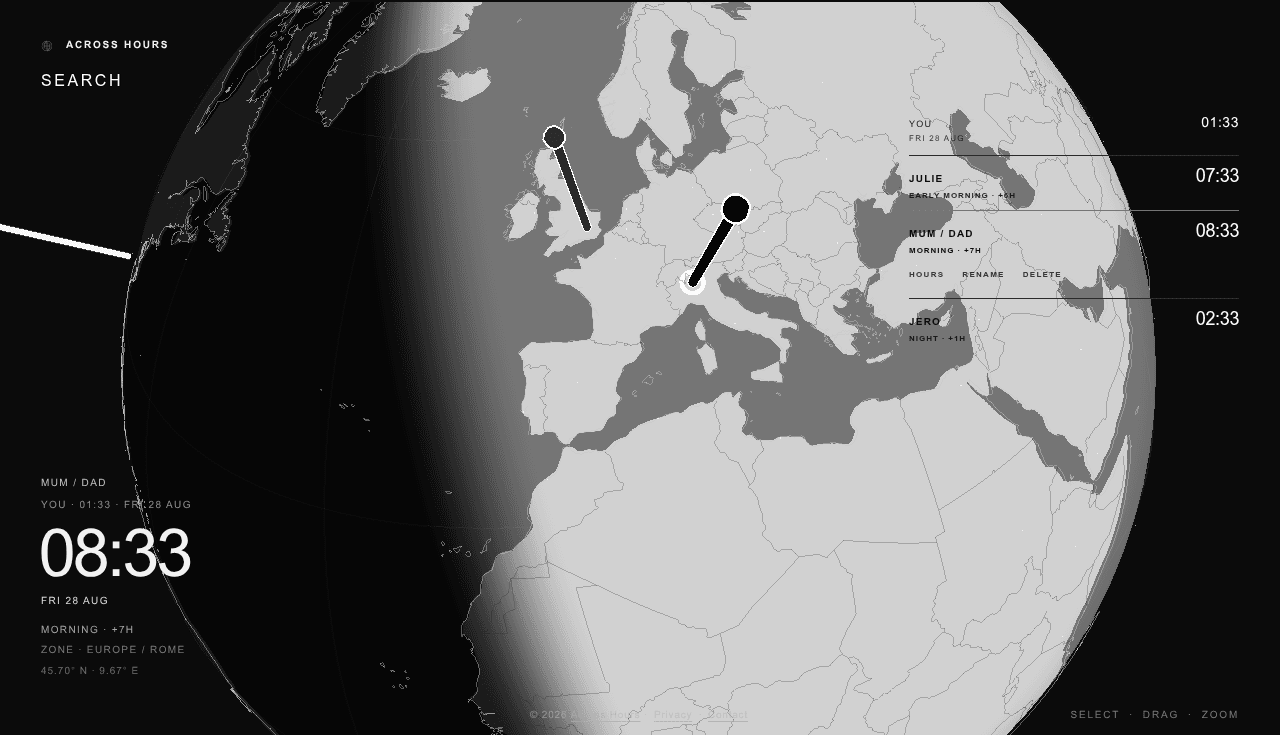
Selected decisions
The product changed through calibration, not decoration.
Calibrated a single smooth twilight transition rather than a hard split.
Daylight reads naturally without losing the graphic clarity of the monochrome globe.
Render on demand during interaction, time updates and visual changes.
The globe can feel alive without continuously doing unnecessary graphics work.
Package core geography, place and timezone resources with the application.
Search and time resolution remain fast and resilient without a heavy server dependency.
Use approximate, local-first location context without persisting raw IP addresses.
The product can be useful immediately without turning location into invasive tracking.
05 / Engineering
Designed and engineered as one system.
The architecture follows the visual goal: keep a live 3D globe immediate and tactile without treating a focused world-time utility like an endlessly running graphics demo.
Rendering architecture
A React interface wraps a Three.js rendering core. Globe geometry, geographic layers, solar state and interaction are tuned as one visual system rather than independent widgets.
Performance model
Rendering is demand-based. Interaction wakes the scene when it needs to move; otherwise the application avoids a permanently running WebGL loop.
Offline resilience
The PWA build precaches the shell plus geography, place, timezone and identity resources, supporting an installable experience with core data packaged locally.
Verified production evidence
Measure the implementation, not just the intention.
These figures come from the production build, Lighthouse and the automated test suite captured on 28 August 2026.
Desktop Lighthouse
Performance audit · 28 Aug 2026
Mobile performance baseline
Lighthouse · 28 Aug 2026
App JS · gzip
793.3 KB uncompressed entry
Automated tests
35 test files passing
Desktop: FCP 0.5 s · LCP 0.6 s · TBT 140 ms · CLS 0
Mobile: FCP 2.1 s · LCP 2.4 s · TBT 1.97 s · CLS 0. The mobile blocking-time result is a current optimisation target rather than a number to hide.
Mobile & home screen
The experience leaves the desktop.
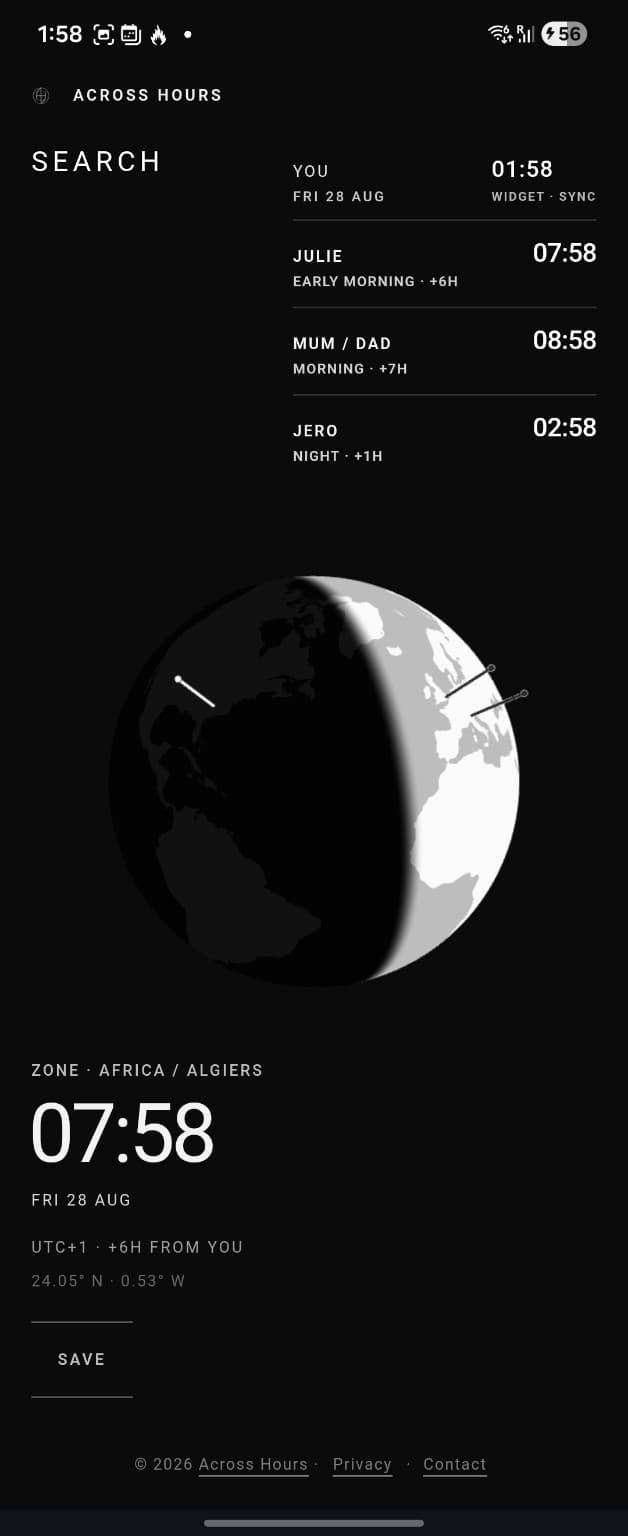
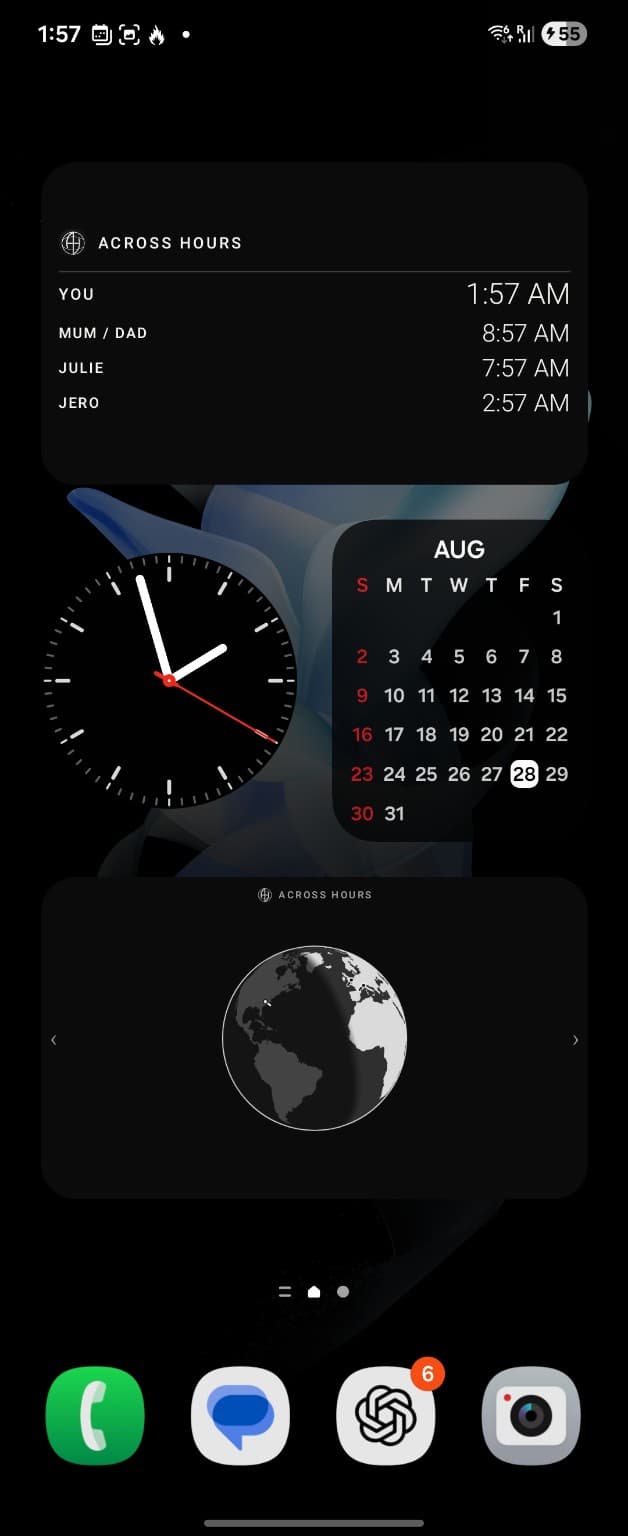
The same spatial time model adapts to a vertical mobile layout, while saved times can be surfaced directly on the Android home screen. These are real production states captured on 28 August 2026 rather than device mockups.
06 / Product localisation
One product, three languages.
Across Hours was designed to feel native in English, Italian and Spanish — not merely translated after the fact.
- EN
- English
- IT
- Italiano
- ES
- Español
Coordinating across time zones is already demanding. Understanding the interface should not be another task.
“Good time to connect” and “Not a good time now” need to communicate the same clear distinction in every supported language. Contact hours and next availability should help someone decide when to reach out, without first interpreting unfamiliar wording.
That consistency extends across navigation and menus, onboarding and tutorial actions, search, saved-person and contact UI, availability language and sharing flows. Explanatory product pages, locale-aware date and time presentation, accessibility labels and user-facing status messages belong to the same experience.
Explicit product localisation provides the English, Italian and Spanish experience, without a runtime translation service. The work is to make the same concepts and actions understandable throughout the product in each language.
From the interface to the data
The interface could now speak three languages. The geography could not.
Localising the product exposed a deeper problem: city names themselves are multilingual. A familiar search interface still needed to recognise the names people actually use.
07 / Multilingual geographic search
One city, many names.
Rebuilding geographic search so language changes discovery and presentation — not identity.
Finding a city should not depend on knowing what the dataset calls it.
The original search had a subtle international UX flaw: a city could sometimes only be found using the exact name form retained by the geographic dataset. Someone looking for Firenze might know it as Florence. For a world-time product, that friction was too much. The fix was a new search architecture, not simply a translated city list.
01 / Search aliases
- München
- Munich
- Munchen
- Monaco di Baviera
- Múnich
02 / Geographic identity
One place.GeoNames ID 2867714
03 / Localized display name
- English UI
- Munich
- Italian UI
- Monaco di Baviera
- Spanish UI
- Múnich
- Firenze / Florence→ one place
- Köln / Cologne / Colonia / Koln→ one place
- Sevilla / Seville / Siviglia→ one place
- Praha / Prague / Praga→ one place
The data pipeline
Language belongs around the record.
A versioned multilingual place-index pipeline built from GeoNames keeps one stable ID per city, with language-aware aliases and English, Italian and Spanish localized place names. Local names and endonyms support discovery where reliably available.
Accent-insensitive matching, transliteration and spelling tolerance help people find places naturally. Locale-aware search ranking and geographic qualifiers resolve ambiguity. Internationalization changes discovery and presentation while user-owned saved person labels remain untouched.
Search runs locally and works offline, with no runtime translation API. Only the compact generated index reaches the application.
Ranking in context
One word can still mean different places.
- English UI · “Colonia”
- Colonia, New Jersey can legitimately rank first.
- English UI · “Colonia Germany”
- Cologne resolves through the geographic qualifier.
- Italian UI · “Colonia”
- Cologne ranks first through locale preference.
Names are interpreted in context, rather than applied as a blind global alias replacement.
Performance budget
More ways to find a place. A measured cost.
| Version | Raw JSON (bytes) | Gzip (bytes) |
|---|---|---|
| v1 | 3,304,322 | 1,504,760 |
| v2 multilingual | 4,429,824 | 1,837,850 |
+333 KB compressed · approximately +22%
The additional compressed data was an accepted product trade-off for better discovery. The production place index is about 1.84 MB gzip. Performance optimization here means choosing what ships: the roughly 783 MB alternate-name source stays at build time and is never delivered to users.
Multilingual release / Production validation
Geographic places
One stable identity per city
Automated tests passing
Multilingual release suite
Production search checks
Real multilingual place data
Localized presentation
Offline-capable search
The release was also manually validated live. Confirmed in production with English presentation:
- “Monaco di Baviera” → Munich
- “München” → Munich
- “Firenze” → Florence
- “Praga” → Prague
08 / Result
Across Hours was designed and shipped end to end as a production-ready, installable world-time experience. It combines live solar visualisation, responsive interaction, privacy-aware location context and demand-based rendering in a deliberately minimal interface.